excel做标准曲线的操作流程
excel作为处理数据的一大利器,很多人在毕业论文、实验报告等等里面都会实用数据再加工,然后数据转换成图标等更直观的展现形式,这样才能一目了然,对于数据在整体中的变化更加得心应手。那么今天我们就一起来了解一下excel做标准曲线的操作流程。
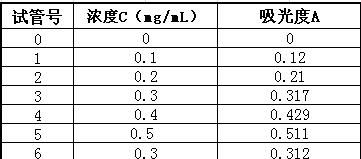
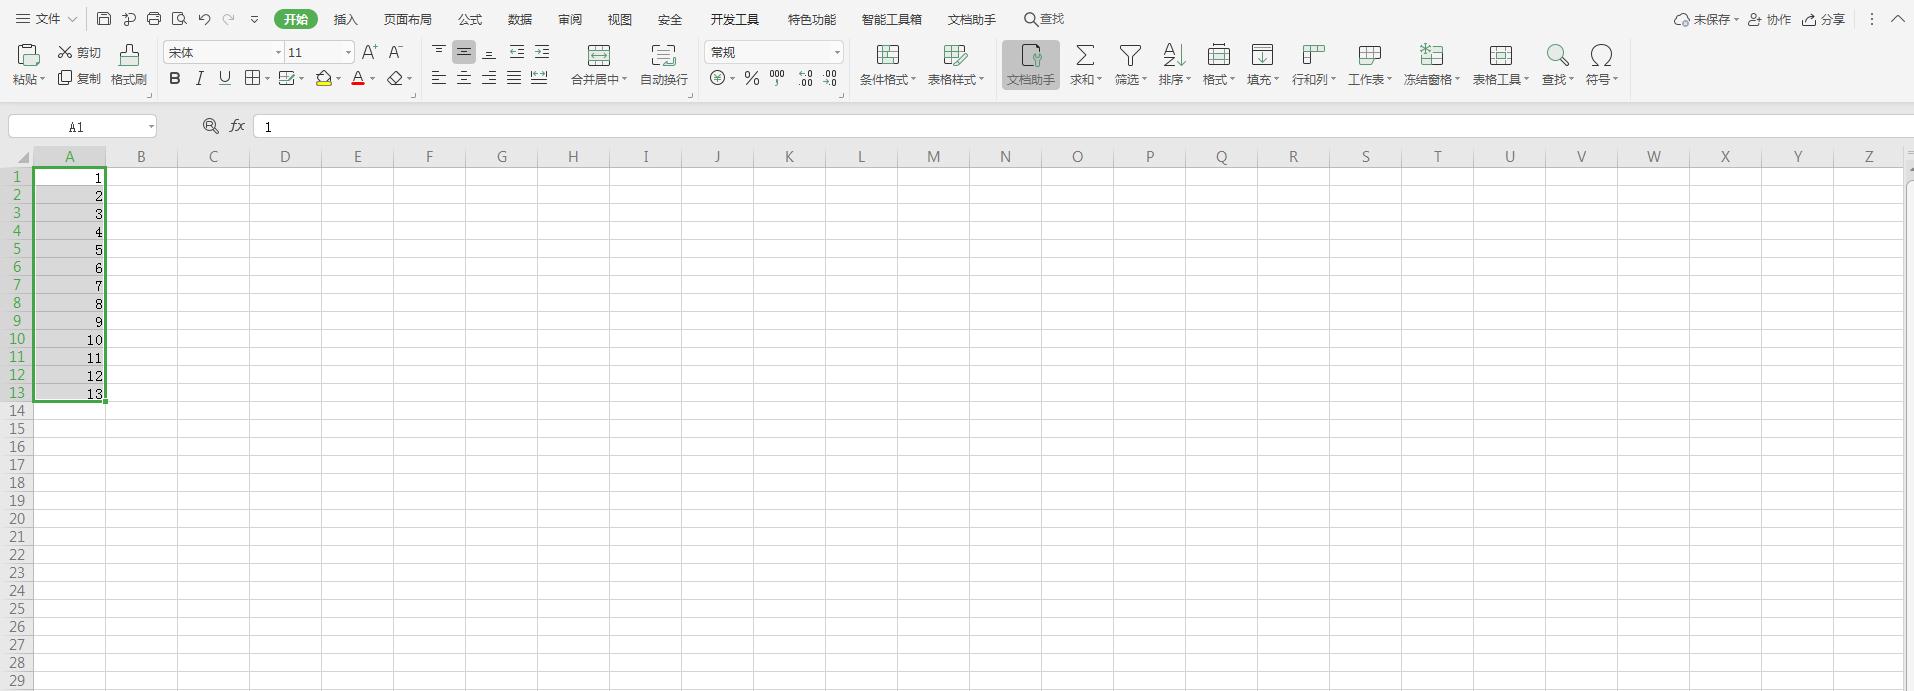
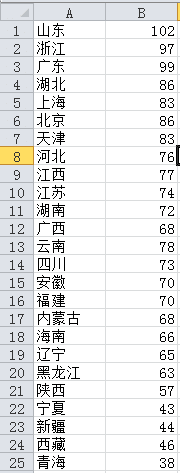
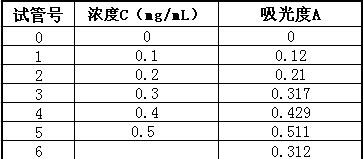
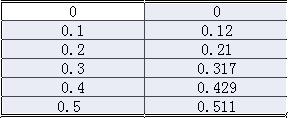
1、输入相应数据
2、选中相应数据
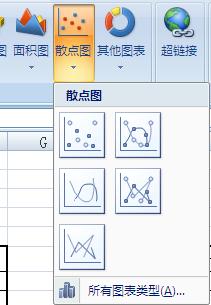
3、在上方工具栏里选插入散点图,并选中第一个类型的散点图
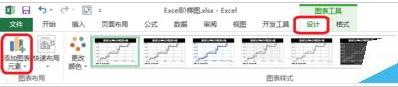
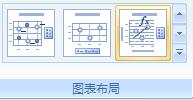
4、选中插入的图表在工具栏里的图表布局里选中第三行最后一个。
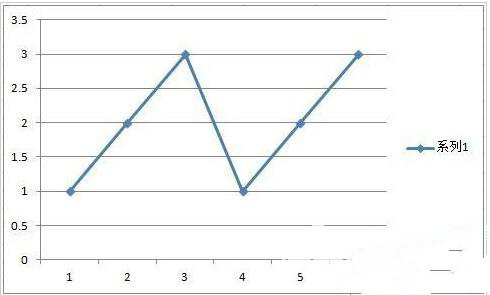
5、选中后可得到如下图表:
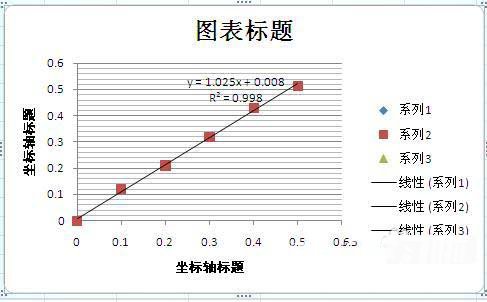
6、点中坐标轴标题,可作修改
7、修改后,得到下图
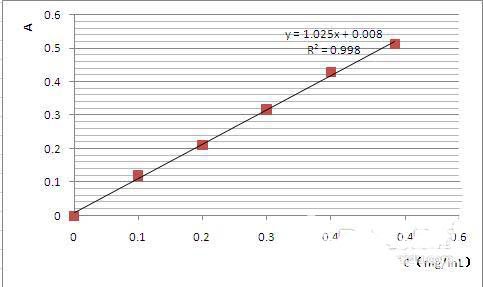
8、将试管6中的吸光度值代入图表中得到的公式Y=1.025X+0.008后可得到所求成分的含量,即X的值。