excel误差线的添加方法和操作流程
很多数据图表是需要误差这一项数据,如何添加误差线这个数据呢?其实很简单,同学们要好好学习哦,接下来就是excel误差线的添加方法和操作流程。
一、2013Excel误差线按钮
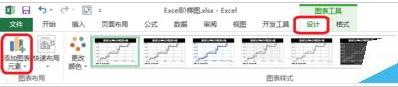
1、点击图表工具——设计——添加图表元素。

2、点击误差线——标准误差——百分比误差——标准偏差——其他误差线选项。
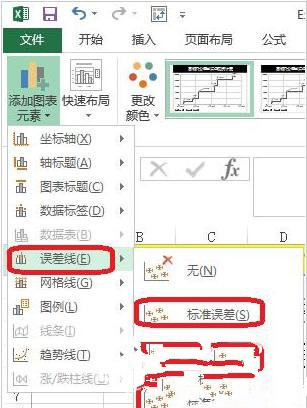
3、如图所示点击标准误差。分为X轴偏差——Y轴偏差。X轴偏差向右。
二、误差线设置
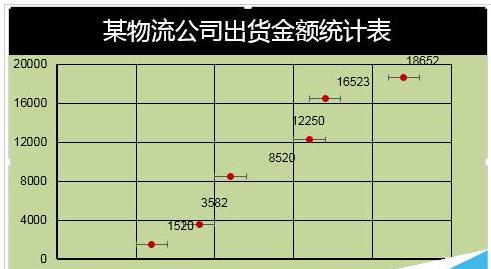
1、图表工具——格式——系列出货金额Y误差——设置所选内容格式。负偏差。

2、图表工具——格式——系列出货金额X误差——设置所选内容格式。正偏差。

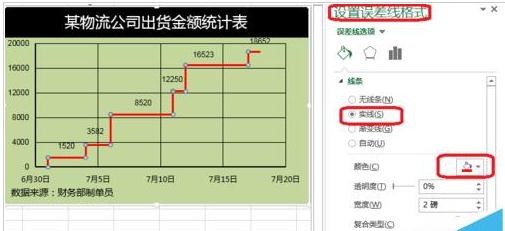
3、点击设置误差线格式——通过自定义(指定值)来对误差进行设置。
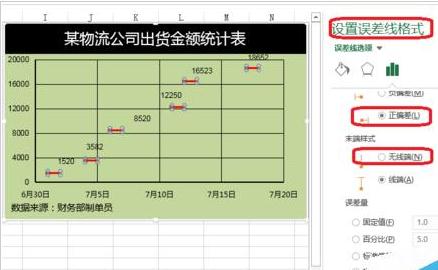
4、点击设置误差线格式——填充,对误差线的颜色等进行设置。